The evolution of Earth observation
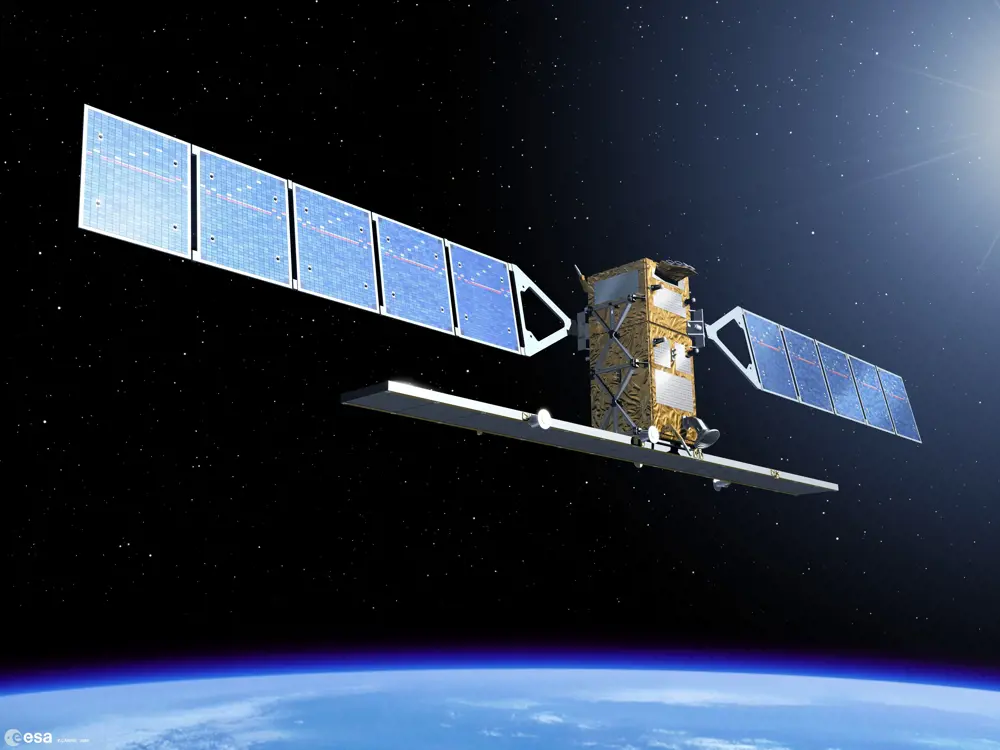
An artists view of Sentinel 1 © ESA - P. Carril
Earth observation satellites have, after many years in orbit, collected information for environmental monitoring, meteorology and map-making, among many other functions. However, until recently, companies and researchers found it hard to access satellite data. Before the 21st century, a handful of government-funded missions supplied images to defence and government users. Everyone else had to buy satellite data, which was expensive even for rich oil and gas companies. There were so few images available that some satellite data analysts had just one image a year to work from.
Now, however, Earth observation has started to change. The sector has gone from an age of data starvation to an era that could almost be called data overload. In the US, the Landsat programme is the longest-running provider of satellite imagery of Earth, which registered users can access for free. Its first satellite was launched in 1972 and the most recent, Landsat 8, in 2013, with just two of the eight satellites launched as part of the programme still running. During that time, images from Landsat satellites have assisted with natural resource management and environmental disasters, and even helped one researcher discover new species of butterfly and snake in Mozambique.
Meanwhile, in Europe the European Union and the European Space Agency (ESA) collaborated on Copernicus, the multibillion-pound Earth observation programme described as the largest in the world. Consisting of a family of Sentinel satellites that circle the Earth at different altitudes and orbits, Copernicus provides images free to registered users in academia, as well as entrepreneurs looking to develop commercial applications. Copernicus launched the first satellite of the constellation, Sentinel 1A, in 2014 and now flies seven satellites.
The speedy development of electronics, the emergence of smartphones, and ever smaller and cheaper, yet more powerful, computational devices have also led to such instruments as CubeSats. These shoebox-sized, inexpensive satellites can be built and launched within a few months with technology that is sophisticated enough to provide usable observation capabilities in low Earth orbit, such as remote sensing or communications. The boom in development of CubeSats has meant that more than 800 satellites had been launched by April 2018.
However, all these companies face the same challenge: how to extract valuable information quickly and reliably from the large amounts of data that pour in from satellites
Developments such as Copernicus have led to an exponential increase in the availability of Earth observation imagery. Where previously satellite images were too few and too expensive for analysts to work with, companies looking to take advantage of the view from space can now work with more than 70 free, high-quality, optical images a year, for any location in the world. However, all these companies face the same challenge: how to extract valuable information quickly and reliably from the large amounts of data that pour in from satellites.
Artificially intelligent analysis
Whereas in the past a human analyst from an organisation would spend weeks analysing a single image, engineers from third-party companies now train computers to scour the satellite data as it comes in. That data has already sparked off a wave of new applications: frequent images of the same area allow these companies to monitor changes and can provide valuable insights for a wide range of industries, from agriculture and mining to insurance. However, such is the rapid change in the technology that companies providing these services can find it difficult to persuade potential clients that satellite data really can provide useful information and even save costs.
Whereas in the past a human analyst from an organisation would spend weeks analysing a single image, engineers from third-party companies now train computers to scour the satellite data as it comes in
Philip Briscoe, Chief Operating Officer of geospatial data analytics company Rezatec, based at Harwell Campus in Oxfordshire, says that customers’ interest increases as soon as they see how easy it is to solve their problems with intelligence derived from satellite images. For example, one of Rezatec’s projects was a collaboration with Portsmouth Water, which had witnessed rising nitrate levels in groundwater for some years and wanted to understand more about the sources of this pollution. Removing the contaminants and making the water fit for human consumption needed a complex and costly treatment process, and the water company hoped that discovering the source of the problem would solve the situation much more efficiently.
Portsmouth Water was not only interested in land management related to farming but also that related to equine use, for example horse paddocks and manure heaps, which can all produce varying localised sources of nitrate pollution. Rezatec initially used its crop identification and land use algorithms to interpret satellite data to produce an interactive map. Using modelling techniques to analyse the topography and hydrology of the area, the likely overland flow of nutrients and pesticides that impact pollution was mapped, along with overland flow paths and sinkholes that allow nitrate pollution to enter the groundwater.
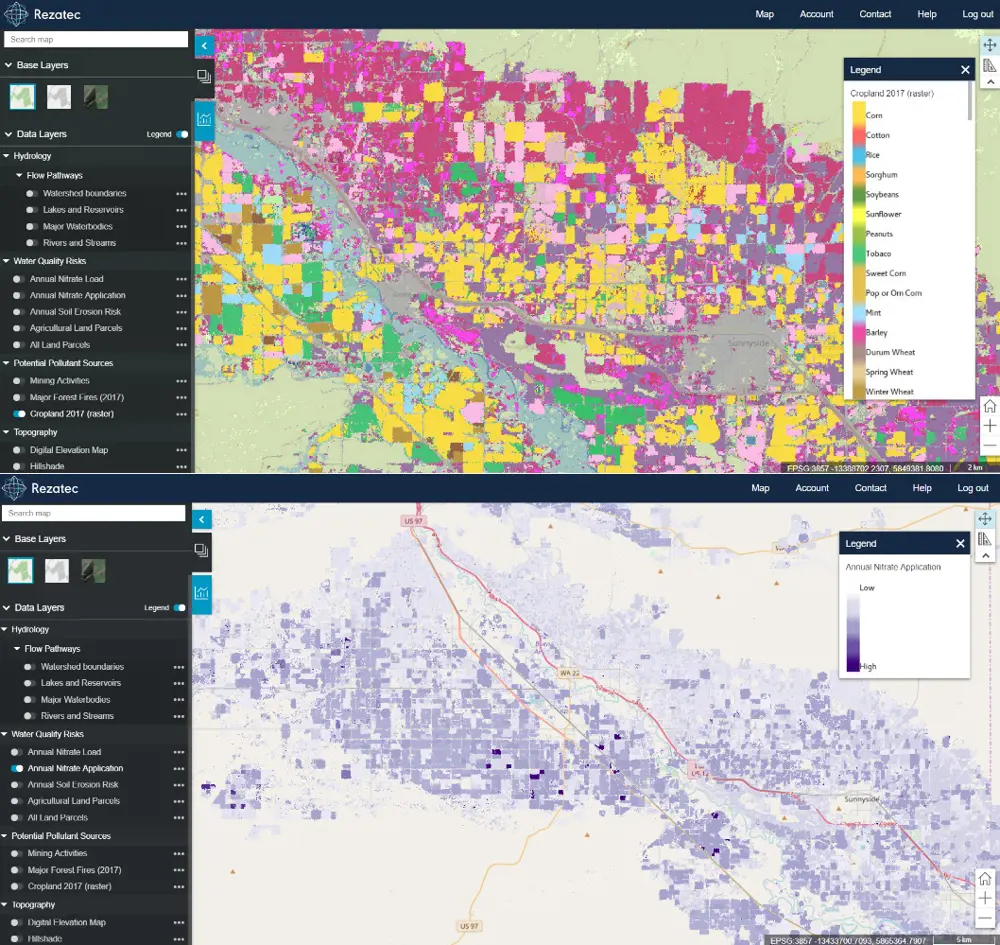
Rezatec’s approach helps water utilities identify risk of pollution from agricultural land use. The top image shows the automation of crop identification through the interpretation of satellite data (radar and optical) using machine learning techniques. Engineers feed vast volumes of data into Rezatec’s crop ID model to train it to recognise the ‘signature’ of specific crops with over 97% accuracy. The bottom image shows estimates of nitrate application volume based on crop type and application of fertilisers, which is then fed into the model to map risk to water sources, such as rivers and reservoirs, to support catchment management activity © Rezatec
It knew that the area that Portsmouth Water operates on is situated on chalk land, which meant that it was very easy for surface water to penetrate into groundwater. While there was nitrate from equine activity, the problem was exacerbated by the volume of sinkholes in the ground that were leaching nitrates from agricultural activities: rain was washing away pesticides and fertilisers that farmers were using on crops. Using the satellite data, Rezatec could identify which fields were causing the problem and enable Portsmouth Water to interact with landowners to help protect the water resources.
Building on this, Rezatec extended its services to water utility companies by looking at pipeline leakage risk and how to enable more proactive and efficient asset management. This service begins by feeding various types of data into Rezatec’s geospatial analytical engine. This includes weather data, soil maps, satellite data and information about the state of the infrastructure and past incidents provided by the water utility companies. Rezatec then uses machine learning to build an understanding of the conditions under which failures occur. Observations of ground conditions are continually monitored to quantify likelihood of failure across the network. Pipelines at most risk of leakage are highlighted for proactive monitoring and then Internet of Things sensor activity can be fed into the service to pinpoint issues early.
Briscoe says that its pipeline leakage risk service enables water utilities to use their manpower more efficiently and reduce capital expenditure costs such as acoustic loggers; instead of sending ground crews to investigate the entire network at regular intervals, the engineers only go and visit those locations or install loggers where there is a high risk of leakage identified by the system.
This service begins by feeding various types of data into Rezatec’s geospatial analytical engine. This includes weather data, soil maps, satellite data and information about the state of the infrastructure and past incidents provided by the water utility companies
Another company based at Harwell Space Cluster dealing with satellite data also discovered that a once sceptical target industry quickly changed its mind about Earth observation data. In 2014, Imperial College London graduate Gareth Morgan founded Terrabotics, which uses powerful algorithms that transform Earth observation data into practical 3D maps for industries in the natural resources sector. In 2011, while the company was still in development, Morgan and his colleagues started approaching oil and gas companies to offer their algorithms.
As more satellites were being launched and large quantities of data started coming in daily, the oil companies realised that they could use satellite imagery not only for slow-moving tasks such as pipeline planning, but also for near real-time monitoring of activities at their own, as well as competitors’, sites.
Terrabotics artificial intelligence algorithms identify and determine changes in the images – a process that is similar to facial recognition but applied to infrastructure. For example, every five days the company counts new oil-drilling sites, new pipelines and new roads, and supplies the data to oil companies and economists.
One of the areas that Terrabotics monitors is the US state of Texas – one of the most active oil-drilling regions in the world. It was here that the algorithms assessing the satellite data spotted a new pipeline being built over the land of a company that Terrabotics supplies data to, but it was another company building very close to or over its land. Previously, it would have taken the company several weeks to discover the building work but Terrabotics’ algorithms helped them address the problem promptly.
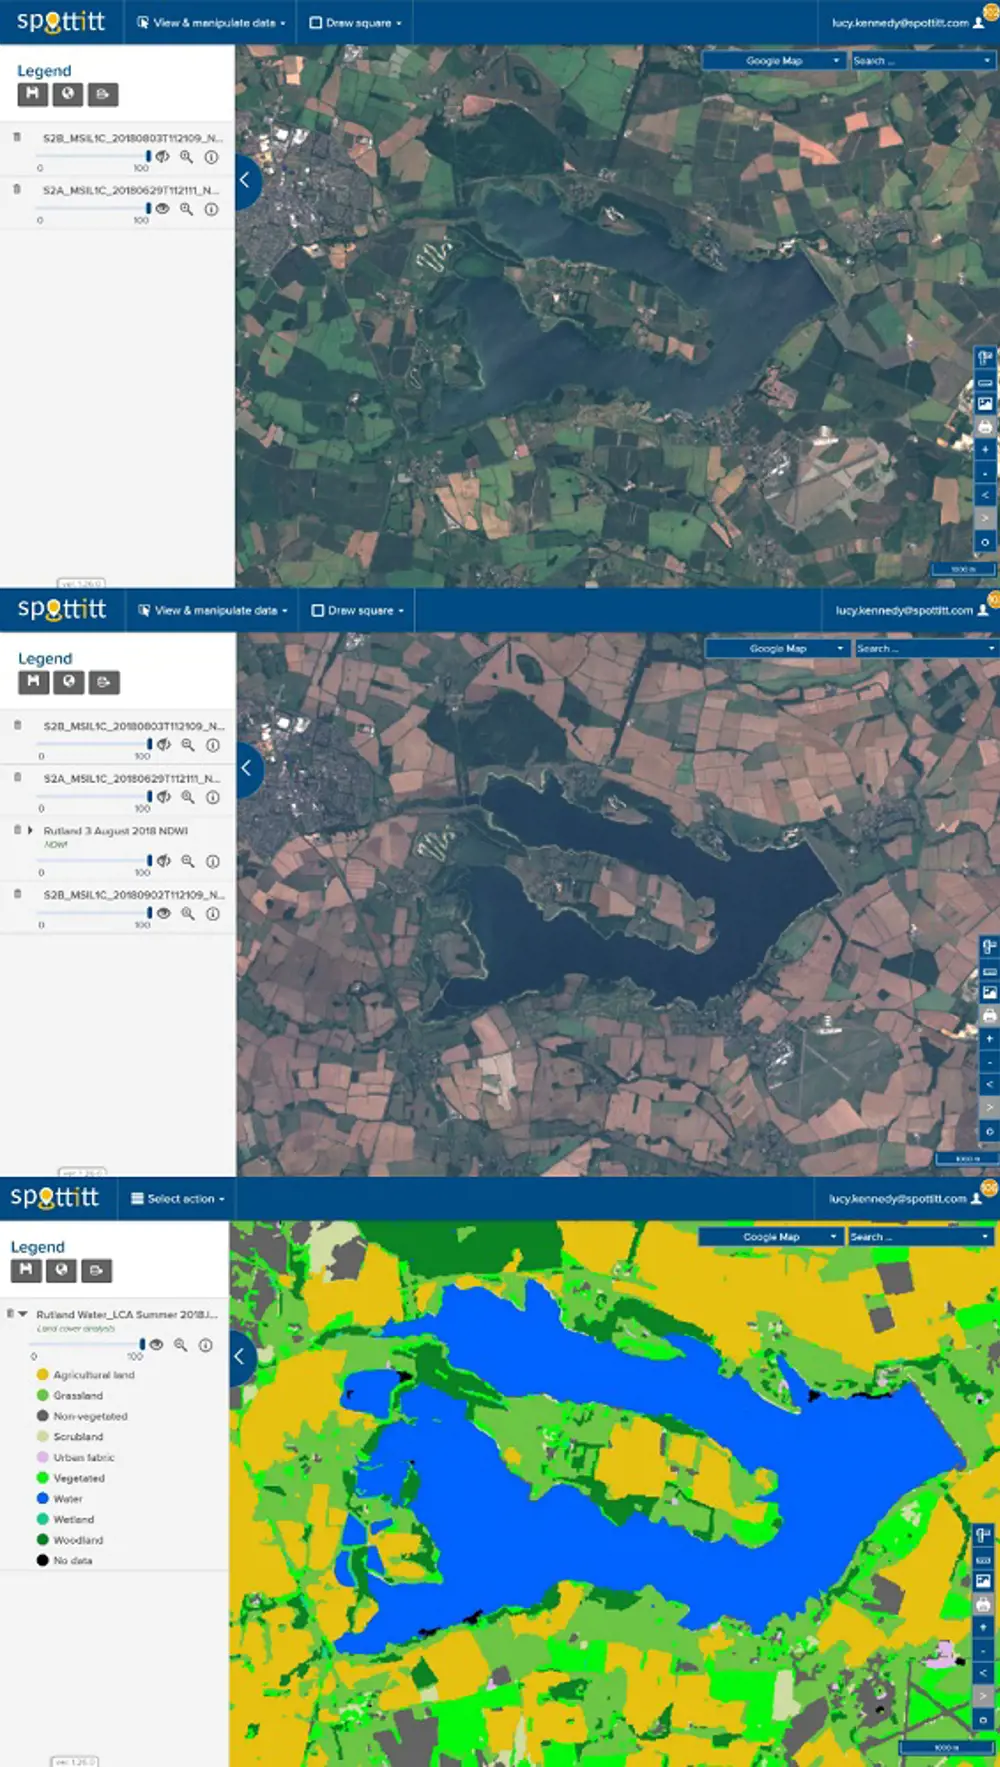
Images from the ESA’s Copernicus Sentinel satellite show the area around Rutland Water in the UK. The top image was taken in June 2018, while the one in the middle was captured in September 2018, demonstrating how the hot summer dried out surrounding fields and water levels in the reservoir dropped. The image at the bottom shows an automated land cover analysis of the same area © Produced from ESA remote sensing data, image processed by Spottitt Ltd
Training algorithms
However, ensuring that the algorithms are reliable is still a major challenge and requires human input to become reliable. They require a huge amount of data and, to start with, human analysts must analyse hundreds of images and label the objects for the algorithm to identify – a task that can need many people at a time.
There are several different approaches that can be used when developing, training and validating an algorithm, but they all require a mix of expertise, trial and error, frustration, and perseverance. This is according to William Ray, Earth Observation Specialist at Spottitt, another Harwell Campus-based startup that provides a range of fully automated analyses based on satellite imagery to the energy, environment and infrastructure sectors. It helps the renewable energy sector find sites with suitable geography for development of new power generation installations anywhere in the world, saving them time and money. Ray says that the challenges of automating complex work processes are significant, involving numerous image pre-processing, algorithm processing and post-processing steps on gigabytes of data, coupled with the complexities of ensuring solid algorithm performance across multiple sources of satellite imagery from across the globe. However, advances in cloud computing, increased image availability and AI techniques have allowed the company to train and validate its various algorithms to help customers understand key factors such as land cover and the location of obstacles such as water and buildings.
According to David Petit, Head of Earth Observation Applications at space systems company Deimos Space UK, the challenges do not end with a working algorithm. Data needs to be presented in the right way for the algorithm to produce accurate results. For example, effects of the atmosphere, such as cloud cover, need to be filtered out. Companies also need to make sure that the location is correct, as some satellites are better than others at knowing exactly where an image was taken.
An algorithm could, for example, misinterpret the fact that two images were taken at different times of the day and attribute the difference in illumination to a change in the scene. Before running its AI algorithms, Deimos puts the incoming data through an intelligent platform, called Service4EO, which corrects and organises the data in an AI-friendly way. The platform gathers inputs from different satellites and other sensors, such as drones and ground sensors, about the areas of interest, for example fields for farmers and agronomists. Service4EO identifies suitable images, clears them of noise and structures them in a coherent way for the AI algorithm to analyse, so that the customer gets the information they need without requiring any special training.
When it comes to training AI, a traditional approach has been about increasing the amount of data used to train the algorithms. However, Gareth Morgan from Terrabotics believes that quality instead of quantity provides better results. By properly refining the original datasets that have trained the AI algorithm, Terrabotics can reduce the amount of training data that needs to be fed into the computer to make the algorithm work reliably.
The company’s key innovation is presenting AI algorithms that perform the eventual analysis data in 3D. Dedicated algorithms automatically transform two or more overlapping images of a scene taken at different angles into a 3D representation. Instead of two cameras imaging a scene at a set distance, the input for the satellite 3D image is usually taken from the same satellite. The company feeds these 3D reconstructions into the algorithm together with the flat 2D images.
The algorithm Terrabotics has developed can extract further information from the 3D images that is useful to customers. It precisely matches pixels between each image, which calculates the 3D shape and heights of the terrain via triangulation. This way, the technology can measure the differences between the different images right down to the ‘sub-pixel’ level.
***
This article has been adapted from "The evolution of Earth observation", which originally appeared in the print edition of Ingenia 77 (December 2018).
Contributors
Tereza Pultarova
Author
Keep up-to-date with Ingenia for free
SubscribeRelated content
Software & computer science
Pushing the barriers to model complex processes
In 2007, Imperial College London spinout Process Systems Enterprise Ltd won the MacRobert Award for its gPROMS (general-purpose PROcess Modelling System) software. Costas Pantelides and Mark Matzopoulos, two of the key people behind the success of gPROMS, tell how they created a way in which engineers can harness physics, chemistry and engineering knowledge within a framework that solves highly complex mathematical problems.
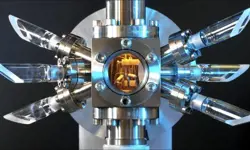
Compact atomic clocks
Over the last five decades, the passage of time has been defined by room-sized atomic clocks that are now stable to one second in 100 million years. Experts from the Time and Frequency Group and the past president of the Institute of Physics describe a new generation of miniature atomic clocks that promise the next revolution in timekeeping.
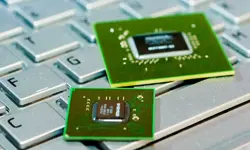
The rise and rise of GPUs
The technology used to bring 3D video games to the personal computer and to the mobile phone is to take on more computing duties. How have UK companies such as ARM and ImaginationTechnologies contributed to the movement?

EU clarifies the European parameters of data protection
The European Union’s General Data Protection Regulation, due for adoption this year, is intended to harmonise data protection laws across the EU. What are the engineering implications and legal ramifications of the new regulatory regime?
Other content from Ingenia
Quick read

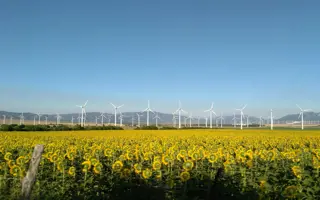
- Environment & sustainability
- Opinion
A young engineer’s perspective on the good, the bad and the ugly of COP27
- Environment & sustainability
- Issue 95
How do we pay for net zero technologies?
Quick read

- Transport
- Mechanical
- How I got here
Electrifying trains and STEMAZING outreach

- Civil & structural
- Environment & sustainability
- Issue 95